How to Set up Visual Studio Code to Debug Requests with Node.js
You can use Visual Studio’s debugging features not just to debug a particular script, but to set breakpoints while your Node.js application is running.
If requests to a given endpoint are not behaving as expected, this is a good way to start fixing the problem.
In this example, I’ll assume you are starting your server process with nodemon, but the steps are similar if you run the server some other way–just make sure you choose the correct config options.
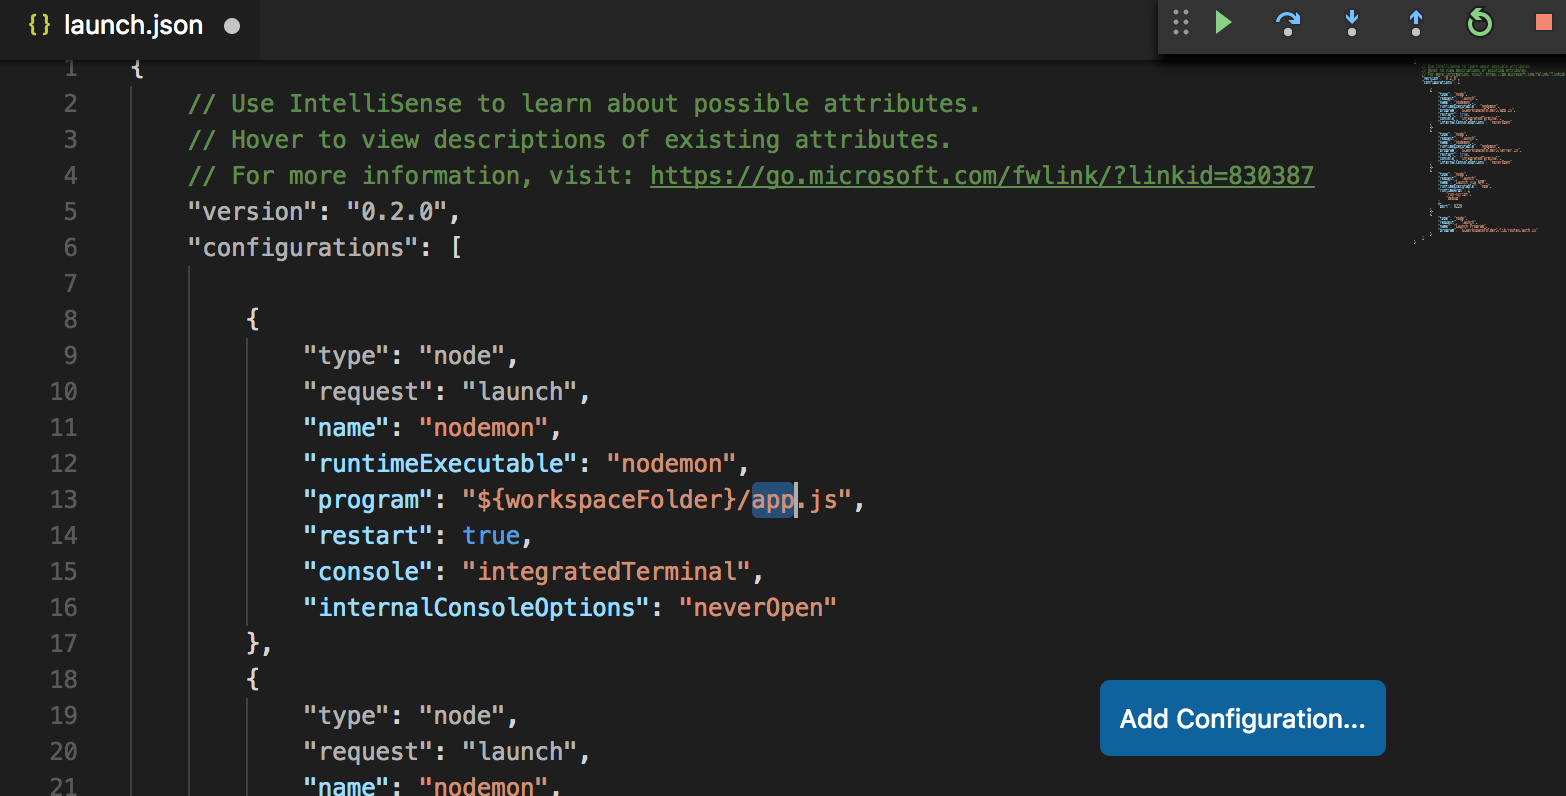
Create the Configuration File
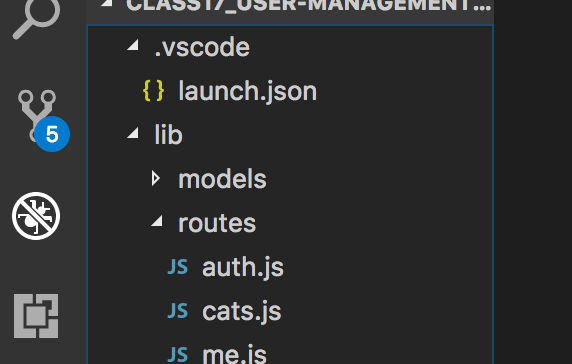
Go to the Debug section of Visual Studio.
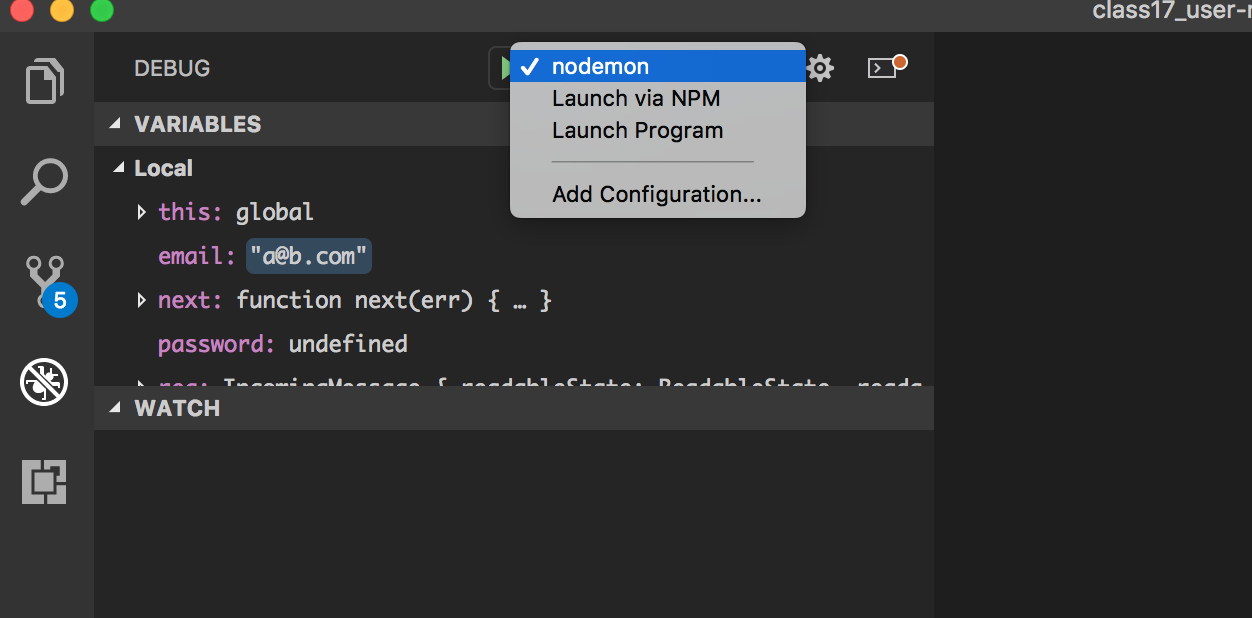
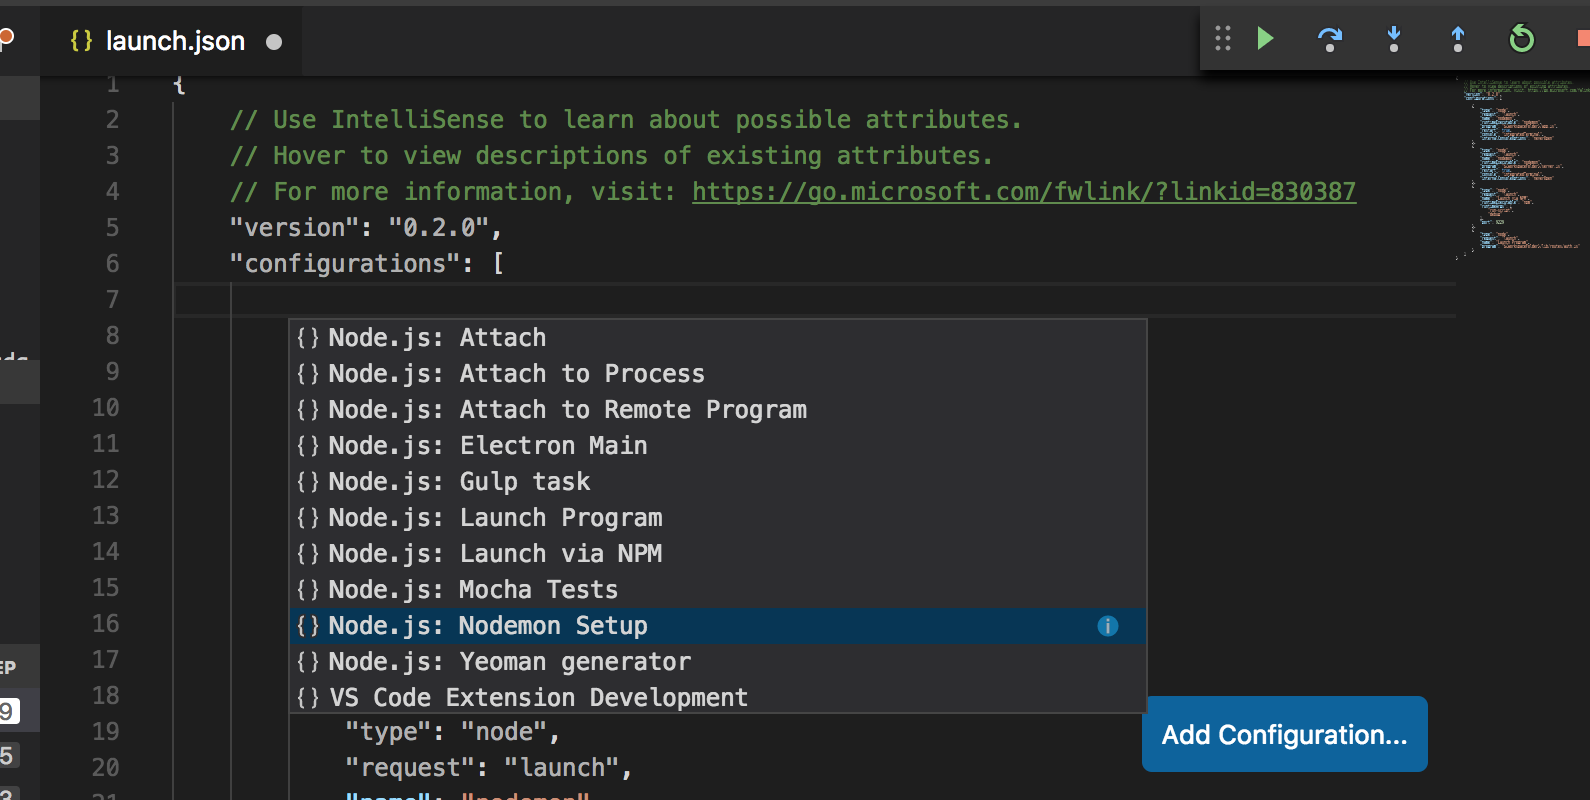
Click the dropdown near the green “run” arrow and select “Add Configuration…”
Select “Nodemon” (or whatever you are using to run the Node server)
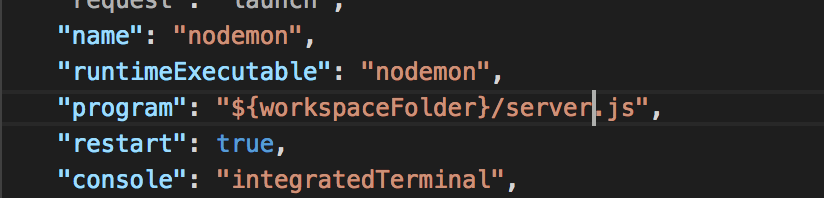
Make any adjustments needed – in this case I need to change the value of "program": "${workspaceFolder}/app.js", to "${workspaceFolder}/server.js"
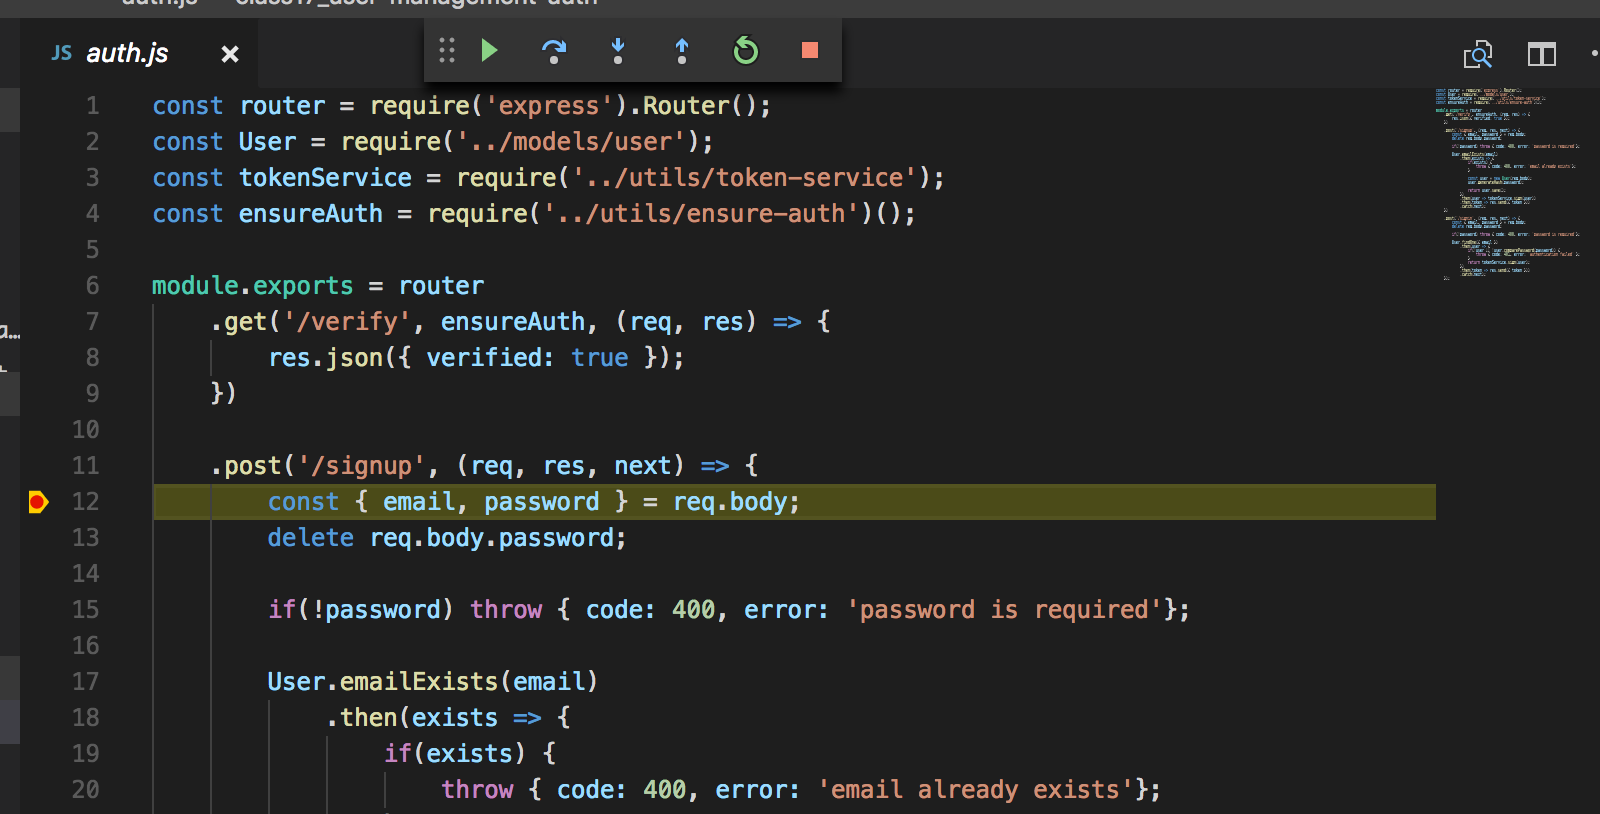
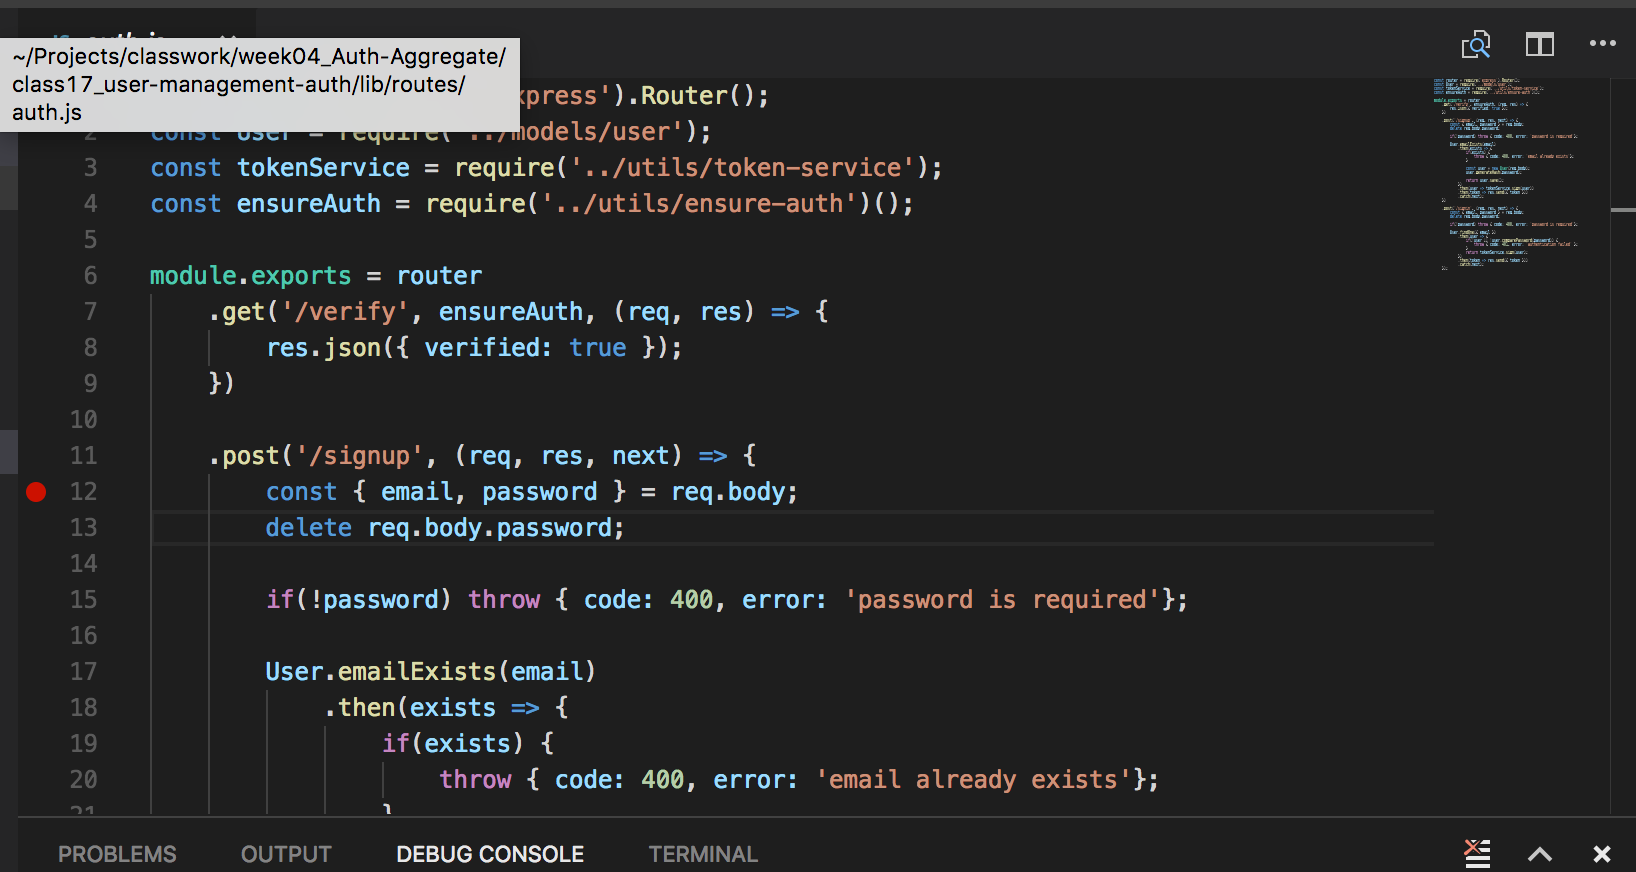
You’re now able to run your Node app with the debugger. If you haven’t already, go into your application code and set a breakpoint. (If you’re not sure where to start, try the first line of your route method.)
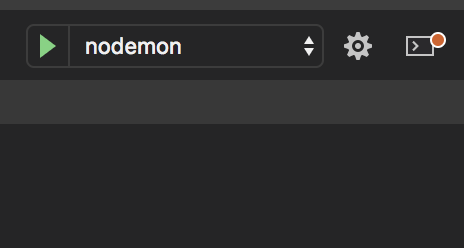
Go back to the debugger section.
Select “nodemon” from the config dropdown.
Click the “run” arrow.
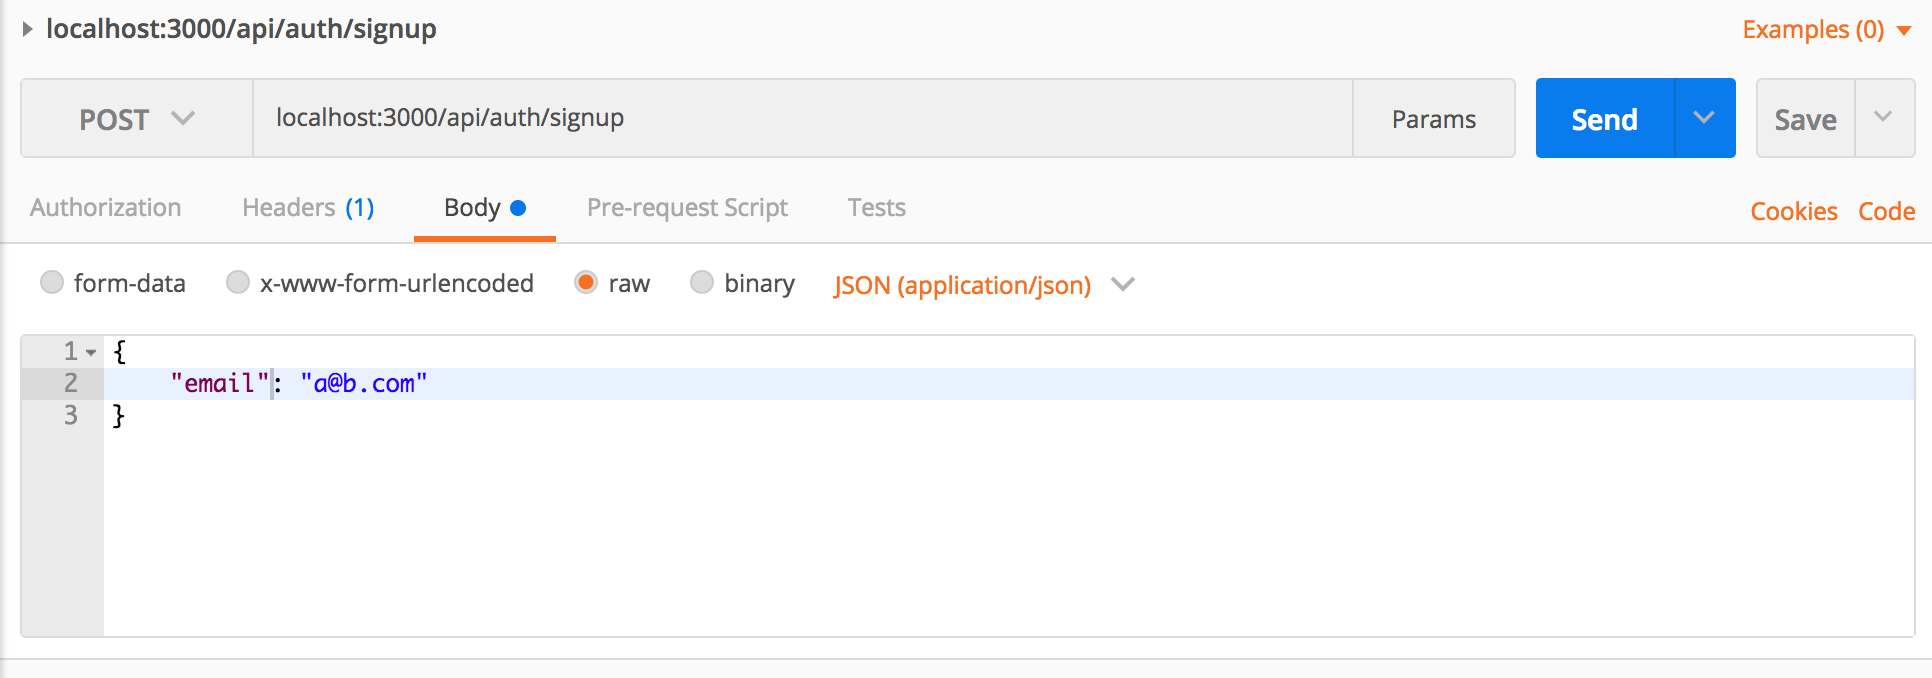
Using Postman or your browser, send a request to the endpoint where you put the breakpoint (using the appropriate request method).
Visual Studio should now be in debug mode, paused on the breakpoint. You can interact with it much like you would the debugger in your browser’s console. Try stepping through the code and stepping into methods.